April 13, 2025
If you’ve ever ridden the Giant Dipper roller coaster down in San Diego, you know the feeling: rickety wooden tracks, sudden drops, and enough whiplash to make you question your life choices. Last week’s markets delivered a similar experience—jarring, fast-moving, and impossible to predict, even for those of us who’ve been at this for decades.
On Monday, April 7, the S&P 500 dropped as much as 4.7% at the session low before whiplashing higher on reports of a potential tariff delay—closing the day up 3.4% from Friday’s close. It was the biggest intraday move since the 2010 “Flash Crash.” Then came Wednesday, when markets staged one of the largest rallies in history after President Trump hit pause on some of his “reciprocal” tariffs. The S&P 500 surged 9.52%—its biggest single-day gain since 2008. Just one day later, on Thursday, the index gave back 3.8%, reminding investors that in markets like these, velocity cuts both ways.
On top of this equity volatility, most other market barometers—widening corporate bond spreads, falling inflation expectations, and cratering oil prices—are consistent with an economy softening or rolling over into recession.
But there was an outlier: Treasury yields. Normally, yields fall amidst stock market volatility. That held true during the big declines on April 3 and 4. But last week saw a dramatic reversal with yields rising and bond prices falling.
Some believe it was the unwind of a popular hedge fund trade that, due to very high levels of leverage, caused the massive selloff. Others believe it was initiated by foreign holders of Treasuries liquidating positions. Either way, we’ve witnessed a historic move in yields. According to Jim Bianco, last week’s rise in the 10-Year Treasury yield was the largest weekly increase since 2001.[i]
This brings us to one key lesson from the past two weeks: periods of crisis and extreme volatility often lead to historical relationships breaking down. Over-levered investors and lack of liquidity can trigger forced selling. And here’s the rub—you don’t know where the leverage and illiquidity are hiding, and therefore, which markets will behave unpredictably.
As we outlined in last week’s client letter, the April 3–4 sell-off was the third worst two-day stretch for the S&P 500 during our careers. We also reviewed how our “All Seasons” approach is designed to insulate your household from short-term uncertainty (via the Protective Reserve) while aiming to provide meaningful long-term growth for future priorities (via Growth Assets). We understand that current events can be nerve-racking, and we want to reiterate: our focus on preparation over prediction matters most during times like these.
As a follow-up, we asked: “How do Growth Assets perform after these periods?” We outline below a cross-section of asset class subsequent five-year cumulative returns. What do we find?
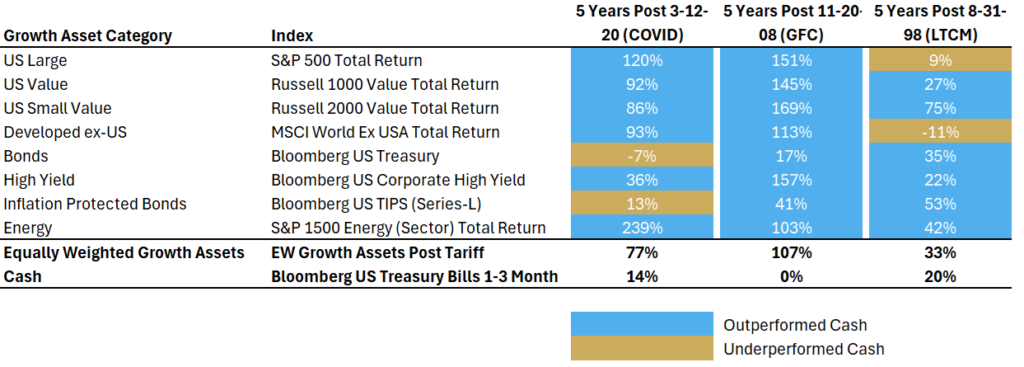
Source: YCharts and Flatrock Wealth Partners. Selection of indices and time periods presented chosen by Flatrock Wealth Partners. Indices are not available for direct investment and performance does not reflect expenses of an actual portfolio.
Selling out of risk assets and going to cash was a bad idea. Markets eventually calmed down, and well-diversified portfolios were better positioned for long-term growth. The shaded blue boxes represent categories that subsequently outperformed cash instruments. Putting all of these together, the returns for the Equally Weighted Growth Assets group consistently outperformed cash, often by very material amounts. Investors who sold Growth Assets and went to cash missed out substantially in the five years post-COVID and post-GFC. Even the five years after the Long Term Capital Management crisis (which included the entire Tech Bubble Bear Market of 2000-2002), investors still had 65% more wealth than had they jumped in cash.
But perhaps even more importantly, the Growth Assets that surged after previous crisis periods shifted over time. After COVID, it was Energy and U.S. Large. After the GFC, it was U.S. Small Value and High Yield. After Long-Term Capital Management, it was U.S. Small Value and Inflation-Protected Bonds. The key is to hold a diversified roster of Growth Assets through crisis periods—you can’t know which will recover strongest. Again: preparation over prediction.
We typically close our client notes with the line, “Markets fluctuate, priorities change. We’re here to help.” It’s not just a tag line. We’ve spoke to almost all of you, our clients, in the past 10 days. But, please feel free to contact us to discuss any aspect of your household’s finances or recent market events. And if you know a friend or neighbor who could use some guidance, we’d be delighted to offer them some perspective in times like these.