Is Minimizing Taxes More Important than Maximizing Performance?
When selecting investment products, our industry relentlessly prioritizes performance. How much return will this investment produce? At first glance, this seems sensible. After all, it is easier to reach long-term goals with higher returns than lower ones.
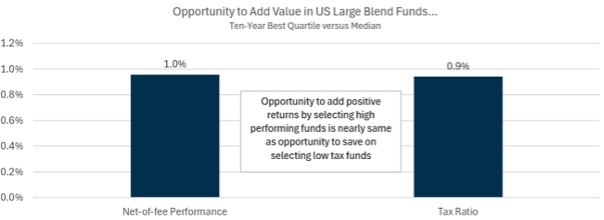
But let’s test that supposition. In the chart below, we examine the difference in ten-year annualized returns (as of November 30, 2025) between top-quartile and median funds in the U.S. Large Blend category.[i] The top-quartile fund produced an annualized return of 14.6% versus 13.6% for the median fund (which approximates the expected outcome of randomly selecting a fund) a net annual difference of 1.0%. Over 20 or 30 years, the power of compounding would turn that annual delta into a meaningful difference in ending wealth, even after accounting for fund fees.
Source: Flatrock Wealth Partners, using data from YCharts
This performance spread represents the size of the opportunity set. In other words, how much potential value might be created by selecting better-performing funds over the average? The wider the spread, the greater the perceived opportunity for skill to add value. This is the core value proposition of advisors who claim the ability to consistently identify top-quartile, or “best-in-class,” funds.
But returning to our headline question: what about taxes?
To evaluate, we use Morningstar’s tax ratio, which measures the annual percentage of a fund’s return paid in taxes.[ii] The higher the tax ratio, the lower the investor’s after-tax return. Here, the observed spread between most tax efficient quartile and the median is approximately 0.9% – nearly identical to the performance differential above.[iii]
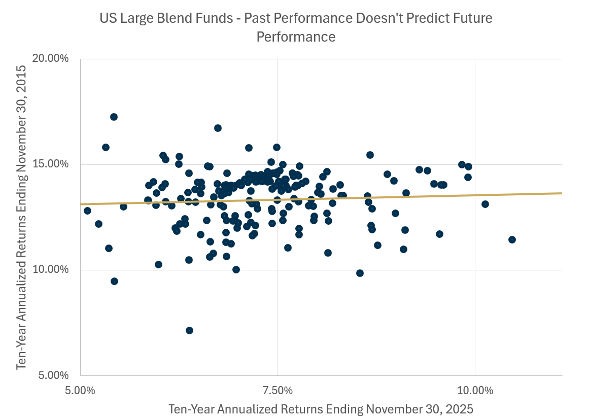
Stated differently, the opportunity to add value through tax efficiency is roughly equal to the opportunity to add value through performance selection. But, hold the phone. This analysis presupposes that fund selection can reliably predict future performance and that assumption is far from certain. See the exhibit below.
a meaningful difference in ending wealth, even after accounting for fund fees.
Source: Flatrock Wealth Partners, using data from YCharts
Using the same universe of funds, we compared ten-year returns ending November 30, 2015 with their subsequent ten-year returns ending November 30, 2025. Each dot represents a fund. If performance were persistent – if winners reliably repeated – we would expect high returns to be followed by high returns and low returns by low returns. The trend line would slope upward. It does not. It is effectively flat. The conclusion is straightforward: past returns offer little to no ability to predict future returns.
Proponents of “top-quartile” selection often counter that performance prediction requires more than numbers alone, pointing to qualitative or “soft” factors such as the capability of investment professionals, consistency of process, or clarity of philosophy. But an oft-cited paper by Oxford professor Tim Jenkinson and his coauthors (2016) finds that these qualitative assessments likewise show little to no reliable power in predicting future investment performance.[iv] Selecting top-quartile funds is exceedingly difficult. Performance matters but it is largely outside our control.
So if we cannot reliably predict returns, can we predict taxes?
Intuitively, this seems more feasible. As we discussed last quarter, funds with higher turnover can be expected to generate more realized capital gains, while funds that emphasize higher dividends tend to produce higher income taxes. And the data supports this intuition. The chart below plots trailing ten-year tax ratios on the horizontal axis and subsequent ten-year tax ratios on the vertical axis. Unlike performance, the relationship is clear: higher historical taxes tend to predict higher future taxes.

Source: Flatrock Wealth Partners, using data from YCharts
Now consider a simple thought experiment. Imagine two fund selectors in the U.S. Large Blend category: Winner Will and Tax-Efficient Ted. Will believes in picking winners and focuses his efforts on identifying top-quartile performers, paying little attention to taxes. Ted, by contrast, ignores performance predictions and concentrates exclusively on selecting funds with lower expected tax burdens.
Assume both succeed in their respective missions over the ten years ending November 30, 2025.
- Will selects a top-quartile performer with a median tax ratio. His fund delivers a 14.59% pretax return but incurs a 1.42% tax ratio, resulting in an after-tax return of 13.17%.
- Ted selects a fund with a bottom-quartile tax ratio but earns only a median pretax return of 13.64%. However, his tax ratio is just 0.48%, leaving him with an after-tax return of 13.16%.
The difference in after-tax outcomes is effectively nil. And because the tax ratio excludes both the Net Investment Income Tax and state taxes, this comparison actually understates the advantage of tax efficiency – meaning that in the real world, where those taxes apply, Tax-Efficient Ted’s edge would be meaningfully larger.[v]
But how likely is it that Winner Will can reliably forecast the best performers in advance? Based on the analysis above, not very. By contrast, Ted’s task – identifying funds with lower expected tax burdens – can be approached with far greater confidence given the observed predictability of taxes.
Carl Richards, a well-known voice in the advisor community, has a simple Venn diagram that is amongst our favorites…in life and investing. One circle is labeled “What Matters,” the other “What You Can Control.” The overlap reads, “What You Focus On.” Performance matters. But it cannot be reliably predicted or controlled. Taxes matter as well – often more so for investors in high-tax states like California – and unlike performance, they can be managed. For these reasons, we focus – perhaps even obsess – on after-tax outcomes. While many in our industry attempt to predict the unpredictable, we prefer to direct our effort toward what can be prepared for and improved.
Data Notes and References
Morningstar, Inc., “Tax Cost Ratio Methodology.” Morningstar Research Methodology, 2024. Available at Morningstar: https://www.morningstar.com/content/dam/marketing/shared/research/methodology/678272-TaxCostRatioMethodology.pdf
Disclosures
Flatrock Wealth Partners LLC (“Flatrock”) is a registered investment advisor.
The information provided is for educational and informational purposes only and does not constitute investment advice and it should not be relied on as such. It should not be considered a solicitation to buy or an offer to sell a security. It does not take into account any investor’s particular investment objectives, strategies, tax status or investment horizon. Flatrock does not offer tax advice. You should consult your attorney or tax advisor. The views expressed in this commentary are subject to change based on market and other conditions. These documents may contain certain statements that may be deemed forward‐looking statements. Please note that any such statements are not guarantees of any future performance and actual results or developments may differ materially from those projected. Any projections, market outlooks, or estimates are based upon certain assumptions and should not be construed as indicative of actual events that will occur. All information has been obtained from sources believed to be reliable, but its accuracy is not guaranteed. There is no representation or warranty as to the current accuracy, reliability or completeness of, nor liability for, decisions based on such information and it should not be relied on as such.
External links may contain information concerning investments, products or other information. Flatrock is not responsible for the accuracy or completeness of information on non-affiliated websites and does not make any representation regarding the advisability of investing in any investment fund or other investment product or vehicle. The material available on non-affiliated websites has been produced by entities that are not affiliated with Flatrock. Descriptions of, references to, or links to products or publications within any non-affiliated linked website does not imply endorsement or recommendation of that product by Flatrock. Any opinions or recommendations from non-affiliated websites are solely those of the independent providers and are not the opinions or recommendations of Flatrock, which is not responsible for any inaccuracies or errors.