
Risk is one of the most frequently used words in investment management. But what exactly does it mean? Risk relative to a benchmark? Risk of underperforming peers? Risk of losing money over a month, a year or a decadeiii? And of all these possible measures, what should we emphasize in building portfolios for affluent families?
Let’s use history to explore. We examined three hypothetical portfolios beginning in 1973: 100% S&P 500, a traditional 60% stock/40% bond portfolio, and an All Seasons Growth portfolio diversified across different economic environments, including growth, recession and inflation. In addition to mainstream stocks and bonds, the All Seasons Growth construct included value stocks, small-cap stocks, non-U.S. equities, energy, credit, REITs and trend following.
The following analysis presents Hypothetical Historical Performance intended as retrospective illustrations, not actual Flatrock client returns. Portfolios were constructed using historical indices and assumptions selected with hindsight, including some that were not investable at the time. Results exclude fees, expenses and taxes. Different assumptions could materially change the outcomes. See Data Notes for methodology and limitations.
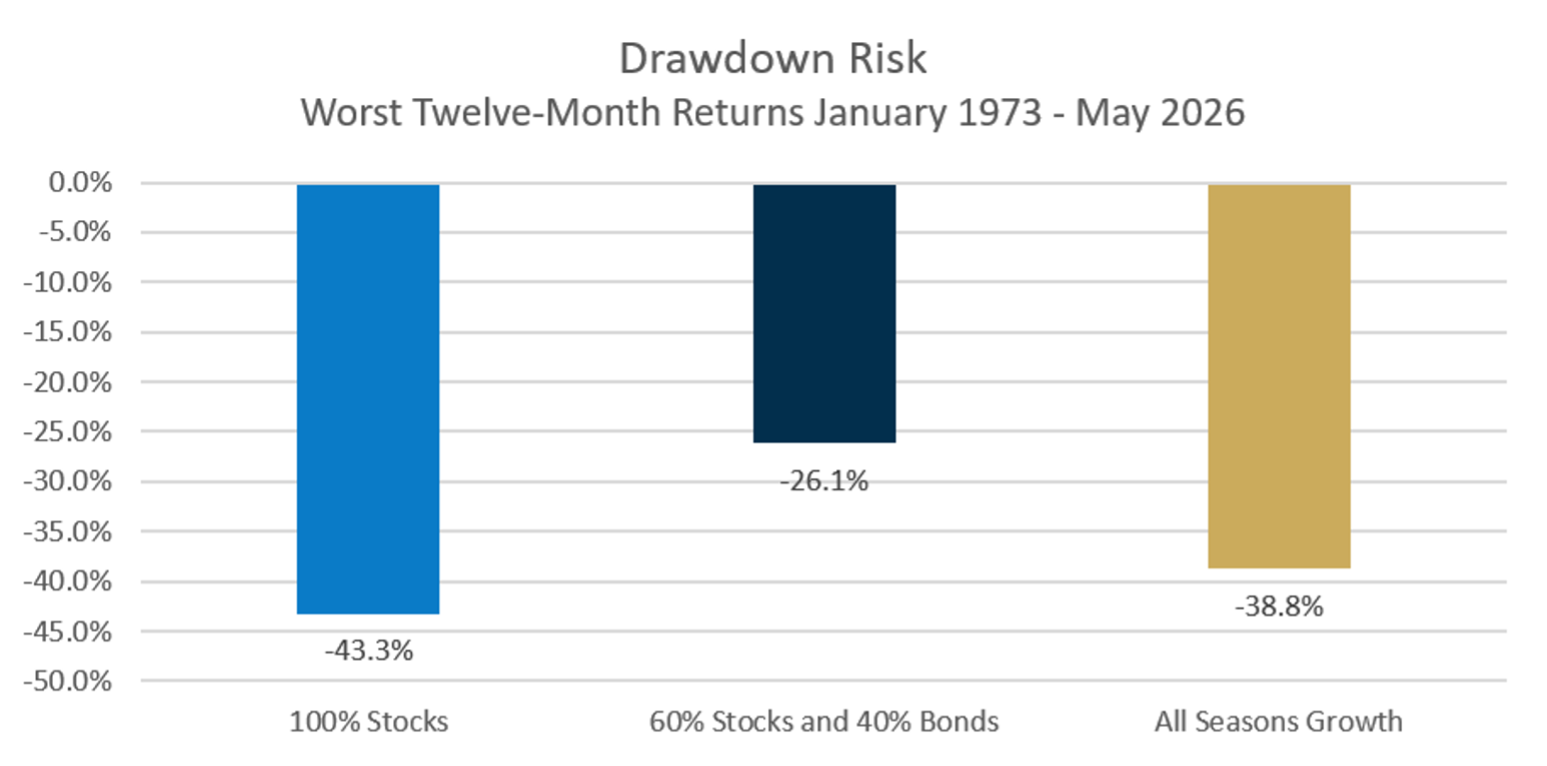
First, consider the worst one-year returns.
TIPS are particularly tax-inefficient in taxable accounts because the annual inflation adjustment to their principal is subject to federal income tax, even though investors holding individual TIPS generally don’t receive that additional principal until maturity. TIPS ETFs typically distribute the inflation adjustment as taxable income, avoiding that particular cash-flow mismatch but not the tax drag.
All of this presumes we can actually manage risk in the first place. As Stanford political science professor Scott Sagan has observed, things that have never happened before happen all the time. Donald Rumsfeld famously referred to these as the “unknown unknowns.”
Sources: Ycharts, Dimensional, Ken French and Flatrock Wealth Partners. Hypothetical historical results, not actual Flatrock client performance. Returns reflect hindsight-based portfolio construction and exclude fees, expenses and taxes.
The worst one-year period for all three portfolios ended in February 2009. Those who lived through the Global Financial Crisis won’t be surprised. The S&P 500 lost 43%, the traditional 60/40 portfolio lost 26%, and All Seasons Growth lost 39%. Scary timesiv.
But these figures primarily describe drawdown risk. How much might a portfolio decline during a particularly bad period? Such losses can become permanent if an investor panics and sells. A mid-career high-earning family with an adequate Protective Reserve has the ability to weather such a storm via their human capital.
In serving affluent families, we need to go a step further.
Howard Marks of Oaktree has long emphasized the risk of permanent capital loss rather than simply volatility. We’d take that idea one step further still, borrowing from former colleague Rob Arnott’s excellent 2006 essay, What is Wealth? Real wealth isn’t what your portfolio is worth today. It’s the lifestyle that portfolio can sustain tomorrow. And real risk is losing the ability to sustain it. That means difficult choices. Selling a home, curtailing family experiences, reducing support for children or grandchildren, or simply living a materially different lifestyle. Those are the outcomes we’re trying to avoid.
And viewed through that lens, a one-year drawdown tells us surprisingly little.
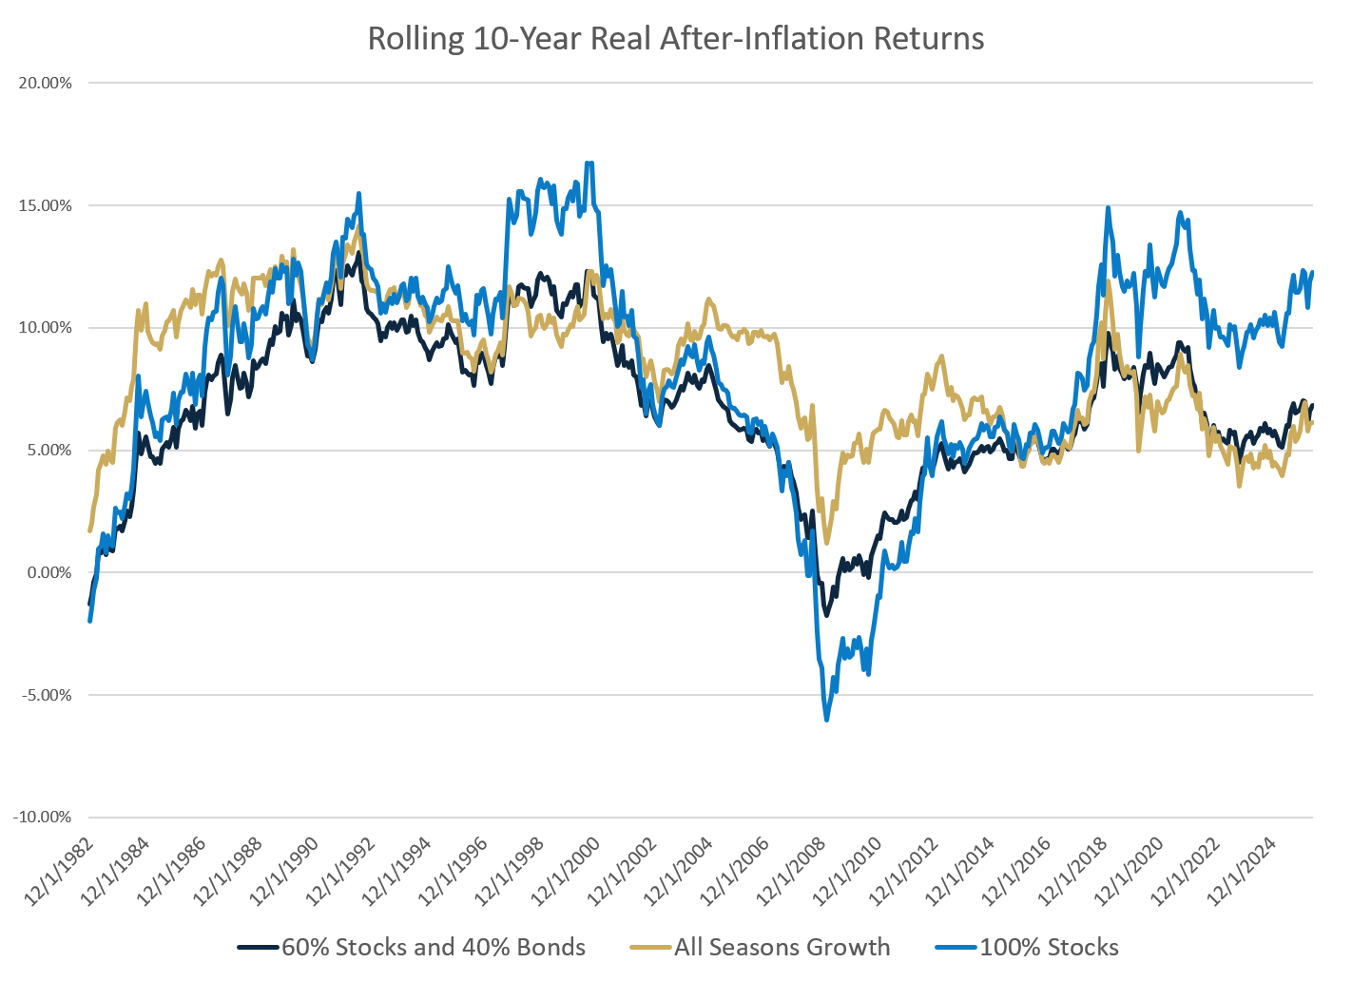
Consider instead the rolling ten-year returns of the same three portfolios, this time adjusted for inflation. After all, the cost of maintaining your current lifestyle will rise with inflation, so what ultimately matters isn’t how much your portfolio grows, but how much purchasing power it preserves.
Sources: Ycharts, Dimensional, Ken French and Flatrock Wealth Partners. Hypothetical historical results, not actual Flatrock client performance. Returns reflect hindsight-based portfolio construction and exclude fees, expenses and taxes.
Two periods stand out. During the inflationary 1970s and early 1980s, both stocks and the traditional 60/40 portfolio experienced extended periods of negative real returns. Then came the 2000s, when the S&P 500 lost more than 5% annually after inflation with two devastating bear markets bookending the decade. After an entire decade of investing, your portfolio ended with substantially less purchasing power than when it started.
But wait. For a family relying on its portfolio to fund living expenses, the consequences were considerably worse.
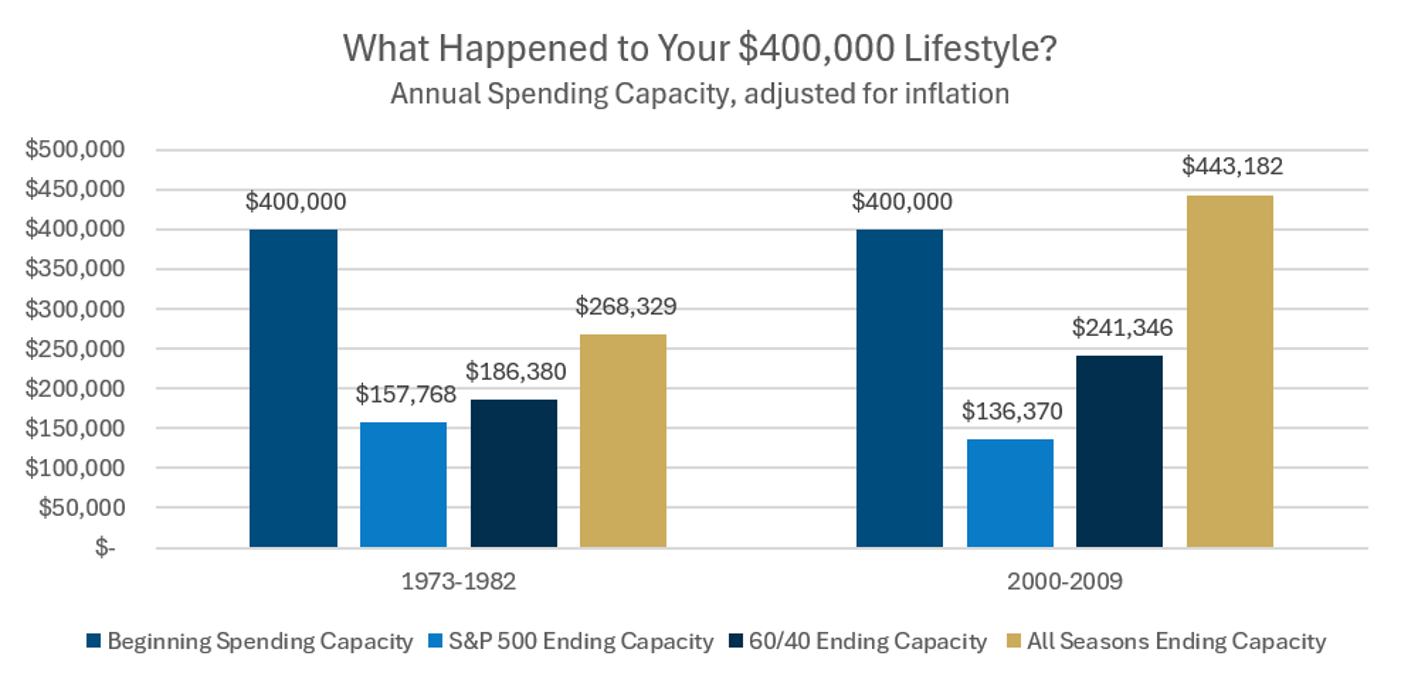
Suppose a family retired with $10 million and began withdrawing 4% annually, increasing those withdrawals with inflation to maintain its standard of living. Using the historical returns of our three hypothetical portfolios, we can estimate how much purchasing power might have remained after a decade of withdrawals. This is an illustrative comparison, not a determination of a sustainable withdrawal rate. The analysis excludes fees, investment expenses and taxes, all of which would reduce the amounts available to support spending.
For the ten years ending in 1982, a portfolio invested entirely in the S&P 500 would have suffered a roughly 61% reduction in real spending capacity. What began as a portfolio supporting $400,000 in annual spending could support only about $157,000 at the end of the decade, using the same 4% measure.
Oof.
The decade ending in 2009 was worse still. That same $400,000 of initial spending capacity would have fallen to approximately $136,000.
Meanwhile, the more broadly diversified All Seasons Growth portfolio would have experienced roughly a one-third reduction in spending capacity during the inflationary decade, but an approximately 11% increase during the so-called Lost Decade of the 2000s.
Sources: Ycharts, Dimensional, Ken French and Flatrock Wealth Partners. Hypothetical historical results, not actual Flatrock client performance. Assumes a $10 million starting portfolio and 4% initial annual withdrawals adjusted for inflation. Results exclude fees, expenses and taxes and do not establish a sustainable withdrawal rate.
One important aside. Nearly all the asset classes represented in our All Seasons Growth portfolio can be accessed through low-cost index funds, direct index separate accounts and ETFs. As we discussed in our July 2025 commentary, complexity doesn’t necessarily earn a return premium. And as we demonstrated in July 2026, the case becomes even less compelling after taxes.
To be clear, an All Seasons approach isn’t immune to losses or prolonged periods of disappointing returns. There are no silver bullets. And these are hypothetical historical results, constructed with the benefit of hindsight, not a promise of future outcomes.
But the distinction matters. Risk isn’t watching your portfolio lose 40% of its value. Instead, risk is discovering that your portfolio can no longer afford the life you planned to live.
Peter Bernstein literally wrote the book on risk, Against the Gods: The Remarkable Story of Risk. In it, he reminds us that the word “risk” derives from the early Italian risicare, meaning “to dare.” As Bernstein put it, “In this sense, risk is a choice rather than a fate. The actions we dare to take define what risk is.”
We think that’s a particularly useful way to frame portfolio construction. The question isn’t whether to take risk. It’s which risks we choose to take, and to what end. We choose to take diversified All Seasons risk rather than make an outsized bet on any one economic outcome. We believe that’s a timeless lesson.
Data Notes
The historical analyses presented in this letter compare three hypothetical retrospective portfolios: (1) 100% S&P 500 Index; (2) a traditional 60/40 portfolio consisting of 60% S&P 500 Index and 40% Bloomberg U.S. Government/Credit Index; and (3) a representative All Seasons Growth portfolio diversified across equities, fixed income, credit, real estate, energy and other asset classes and investment factors. These hypothetical historical retrospectives were developed to better understand how different portfolio allocations might have responded to historical market environments, particularly with respect to drawdowns, inflation-adjusted returns and retirement spending capacity. They are not intended to represent actual investment results or predict future performance.
The portfolios are constructed using representative historical indices rather than actual investment products or client accounts. It is not possible to invest in an index.
Portfolio Construction. The S&P 500 and traditional 60/40 portfolios maintain consistent target allocations throughout the historical period. The All Seasons Growth retrospective uses three sets of target allocations: January 1973–December 1974, January 1975–December 1984, and January 1985–May 2026. These reflect the historical availability of representative indices and the retrospective portfolio construction.
Representative index |
1973–1974 |
1975–1984 |
1985–2026 |
Bloomberg U.S. Credit Bond Index |
10% |
10% |
10% |
Bloomberg U.S. Credit Bond Index Baa |
9% |
9% |
4% |
Bloomberg U.S. High Yield Corporate Bond Index |
— |
— |
5% |
Bloomberg U.S. Treasury Bond Index Long |
4% |
4% |
4% |
Dimensional U.S. Large Cap Value Index |
16% |
16% |
16% |
Dimensional U.S. Small Cap Value EFI Index |
7% |
7% |
7% |
Fama/French International Value Index |
— |
7.5% |
7.5% |
French Research Energy |
8% |
8% |
5% |
FTSE NAREIT Index |
15% |
15% |
15% |
MSCI EAFE Index (gross dividends) |
15% |
7.5% |
7.5% |
S&P 500 Index |
16% |
16% |
16% |
AQR TSMOM Factor |
— |
— |
3% |
Total |
100% |
100% |
100% |