We built a taxable endowment portfolio and graded it. The results may surprise you.
Every field has its elegant theories. Physics tells us that a feather and a bowling ball fall at exactly the same rate…in a vacuum. Finance is full of similarly tidy assumptions. Harry Markowitz’s Nobel Prize-winning work on portfolio construction assumes investors care only about risk and return. William Sharpe’s Capital Asset Pricing Model assumes frictionless markets without taxes, transaction costs or borrowing constraints.
If you’re a wealth advisor today, chances are you’ve heard the pitch. We certainly have. Every week another “alts manager” calls with a new “institutional-quality” strategy. The sales pitch almost always includes another familiar refrain:
“This is how the large university endowments invest.”
The reference, of course, is to Yale University and its legendary CIO David Swensen, whose pioneering allocations to private equity, venture capital and hedge funds reshaped institutional investing. His long-term record deservedly earned admiration. Today, “the Yale Model” has become shorthand for sophisticated portfolio construction, and many wealth management firms encourage affluent investors to adopt a similar approach.
But like the elegant theories above, the Yale Model likewise has a simplifying assumption. Yale doesn’t pay taxes. Affluent families do, especially those in high tax states like California.
Prior research examined how a taxable version of the Yale Model should be constructed using expected after-tax returns. Our analysis instead asks a different question: How much of historical results were impacted by taxes? To our knowledge, this is the first study to measure the realized, after-tax performance of an investable endowment-style portfolio over a long horizon.
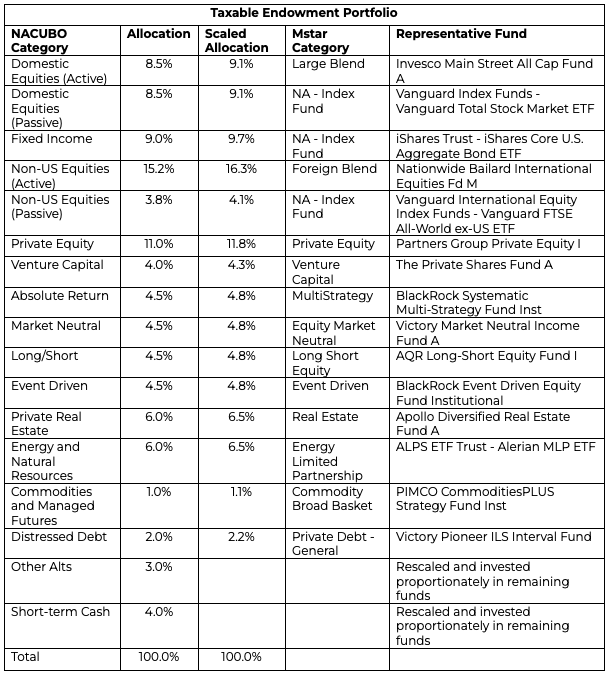
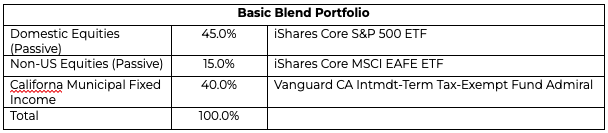
We constructed what we call the Taxable Endowment Portfolio, allocating assets similarly to the median university endowment using data from the National Association of College and University Business Officers (NACUBO) Survey. Each allocation “slice” was then populated with investable funds available to affluent households. We then compared the results with a simple portfolio consisting of 45% in a US stock ETF, 15% in an international stock ETF and 40% in a California municipal bond mutual fund (which we will hereafter call the Basic Blend Portfolio.) See the Data Notes below for specific details.
Unlike the private funds in university endowments, the representative funds that comprise our Taxable Endowment Portfolio report income and capital gain distributions via public disclosures. We therefore can estimate the portfolio level tax drag for a high-income taxable investor over the ten years ending March 31, 2026.
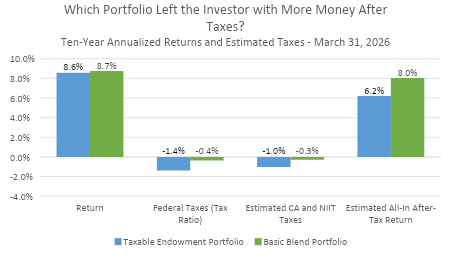
Let’s discuss returns first. Before taxes, the Taxable Endowment Portfolio generated a return that was nearly identical to the Basic Blend – 8.6% for the Taxable Endowment Portfolio versus 8.7% for the Basic Bend Portfolio. After a decade of additional complexity and illiquidity, we observed no meaningful return premium, a finding remarkably consistent with our Second Quarter 2025 Client Letter.
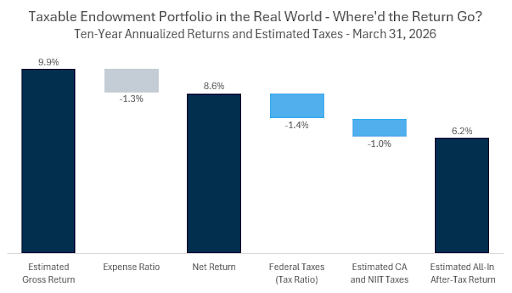
But these roughly equivalent returns mask a huge fee disparity. The returns are net-of-fees. The Taxable Endowment Portfolio carried an average weighted expense ratio of approximately 1.3%, compared with roughly 0.1% for the simple portfolio. Investors paid roughly thirteen times the investment management fees. Interestingly, before those fees were deducted, the underlying investments actually produced higher gross returns. In other words, the gross-of-fee return for the Taxable Endowment Portfolio would have been closer to 9.9% and the Basic Blend would have been 8.8%.
Okay so no big deal. We basically got equivalent returns net-of-fees. But hold the phone. We haven’t included taxes. In the real world, the feather falls much slower than the bowling ball. Air’s friction impacts the feather. Likewise, portfolios incur taxes. Morningstar’s tax ratio measures how much of a fund’s annual value would be lost to taxes. We estimate the Taxable Endowment Portfolio would have incurred approximately 1.4%, more than three times as much to federal taxes as the Basic Bend’s tax ratio of 0.4%.
Sources: YCharts and Flatrock Wealth Partners.
Those estimates, however, exclude both the 3.8% Net Investment Income Tax and state income taxes. To estimate the impact of taxes not included in Morningstar’s methodology, we scaled the reported Tax Cost Ratios to reflect the additional burden of the 3.8% Net Investment Income Tax and California’s 13.3% marginal tax rate. For California residents, we estimate these additional taxes widen the gap substantially, an additional 1% versus 0.3%. Adding it all up, the Taxable Endowment Portfolio compounded at roughly 6.2% after taxes, nearly two full percentage points per year below the Basic Blend. The figure below shows how real-world frictions of fees and taxes erode returns of the Yale Model for affluent tax payers in high tax states like California.
Sources: YCharts and Flatrock Wealth Partners.
A 1.8% annual tax drag may not sound like much. But compounding has a way of turning seemingly small differences into very large ones.
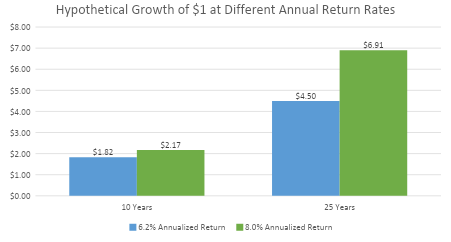
To illustrate, suppose two hypothetical investors each begin with one dollar. One compounds at our estimated 6.2% after-tax return for the Taxable Endowment Portfolio. The other compounds at 8.0%, the estimated after-tax return of the Basic Blend. After ten years, the difference is noticeable. The dollar growing at 8.0% is worth $2.17, compared with $1.82 at 6.2% – nearly 20% more wealth. After twenty-five years, the gap becomes striking. That same dollar grows to $6.91 instead of $4.50 – more than 50% greater wealth from what initially appeared to be a modest 1.8% annual advantage.
Sources: YCharts and Flatrock Wealth Partners.
Oof. This isn’t simply about ending with a larger account balance. It’s about compounding more effectively to meet future financial priorities. If those relative differences persisted, the additional wealth could provide greater resources such as long-term care, education funding, or charitable giving.
With these observations, we decided to issue our own report card of the Taxable Endowment Portfolio in three critical subjects of taxable investment management: Returns, Fees and Taxes.
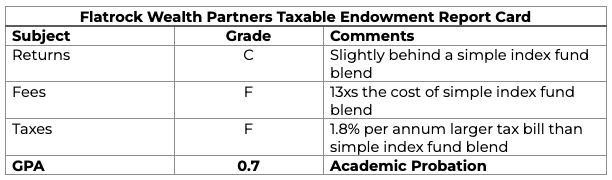
The grades above reflect Flatrock’s subjective assessment of the relative outcomes discussed above and are intended solely as an illustration.
Speaking of report cards and university life, fans of the late 70’s raunchy comedy Animal House may remember Dean Wormer confronting the Delta House to review their mid-term grades and let them know they were finished at Faber College. When he informed Kent Dorfman of his 0.2 Grade Point Average, he scolded, “Fat, drunk and stupid is no way to go through life, son.”
Faber College is fictional. It doesn’t exist and it doesn’t have an endowment fund. But if it did, we suspect its chief disciplinarian might have offered taxable investors a slightly different piece of advice: “Average returns, high fees, and unnecessary taxes are no way to compound wealth, son.”
One of the bedrock principles behind Flatrock has always been a relentless focus on minimizing the unnecessary frictions that interrupt compounding. Markets fluctuate. Fees and taxes persist. Unlike market returns, they’re one of the few variables investors can actually control.
1Don’t believe us? Spend five minutes on Google searching phrases like alternative investments, institutional investing or exclusive investment strategies. We recently did. Four of the first eight results came from major Wall Street firms, each arguing that alternative investments are a critical ingredient for long-term investment success.
2Geddes, Goldberg and Bianchi (2015) examined how the Yale Model should be adapted for taxable investors using expected returns and mean-variance optimization. It’s a worthwhile analysis that deserves far more attention. Our study addresses a complementary question. Rather than optimizing an expected after-tax allocation, we examine the realized experience of a taxable investor who implemented an endowment-style allocation using investment vehicles commonly available to affluent households. By incorporating actual historical fund returns, reported taxable distributions and estimated state taxes, we evaluate the after-tax compounding that investors would likely have experienced over the ten years ending March 31, 2026.
3Consistent with our Second Quarter 2025 Client Letter, we used the median endowment allocation from the 2014 NACUBO Endowment Survey.
4On the alternatives side, we now have over ten years of data for interval funds and other semi-liquid alternative investment vehicles commonly used by wealth managers.
5Interestingly, this result is consistent with Berk and Green (2004), who argue that much of the economic value created by skilled managers is ultimately competed away through management fees.
6Morningstar’s Tax Ratio as well as our estimates assume no liquidation taxes (i.e. taxes due if the whole portfolio was sold at the end of the period.) Many investors will not pay full liquidation taxes on appreciated positions and instead rely upon other estate and tax planning levers such as change of state domicile, charitable giving, and step-up in basis at death. Our estimates are intended to approximate the incremental annual tax drag experienced by a high-income California resident. Actual tax rates will vary based on an investor’s federal and state tax bracket, the character of fund distributions, and individual tax planning strategies.
Data Notes
To construct the Taxable Endowment portfolio, we took the median university endowment allocation outlined in the 2014 NACUBO survey and sought to fill using the closest Morningstar Category based on authors’ assessments. The split between Active and Passive Equities are authors’ estimates. For active equities, we selected a fund that most closely matched the median pretax return and 10-year tax ratio of the category. This is consistent with the literature that concludes that manager selection efforts in public equities are very difficult. See Jenkinson et al. (2016). For alternative asset classes, we selected the largest fund in the category by AUM fund that had at least a ten-year track record. This approach implicitly gives the Taxable Endowment Portfolio the benefit of the doubt by assuming investors (or their advisors) successfully identified the leading managers in each category. Because the largest funds often reached that scale through a combination of performance and asset gathering, this assumption likely biases the analysis in favor of the Taxable Endowment Portfolio. We excluded the Other Alternatives and Short-Term Cash allocations from the NACUBO portfolio. “Other Alternatives” could not be mapped to a comparable Morningstar category, while a dedicated cash allocation was unnecessary because interval funds generally accept subscriptions on a daily, monthly or quarterly basis, eliminating the need to reserve capital for future capital calls. The remaining allocations were proportionally rescaled to maintain a fully invested portfolio. This resulted in the following funds and allocations: